Verification and validation
The procedure has been tested on 56 simulations: a grid convergence study, two validation cases against measurements in conical nozzles, and design cases that compare three sizing models for three propellant combinations at two chamber pressures. All were run with ceaToFoam 2.0 and OpenFOAM v2606, and every simulation satisfies the convergence criterion (inlet and exit mass flow rates within 0.5 %).
| Case | Gas | Conditions | Variants | Runs |
|---|---|---|---|---|
| V1 | air | \(p_t\) = 150.6, 250.2 psia; \(T_t\) = 833 K | 30°–15° and 45°–15° nozzles; inviscid, SST | 4 |
| V2 | air | \(p_t\) = 100 psia; \(T_t\) = 294 K | \(r_c/r_{th}\) = 0.25–2.0; inviscid, SST | 14 |
| G1 | RP-1/LOX | O/F 2.4; \(p_c\) = 500 psia | three meshes; inviscid, SST | 6 |
| H1 | RP-1, CH₄, H₂ / LOX | O/F 2.4, 3.6, 6.0; \(p_c\) = 500, 1500 psia | frozen, equilibrium, \(\gamma_s\) sizing; inviscid | 18 |
| H2 | as H1 | as H1 | frozen sizing; laminar, SST | 12 |
| D1 | RP-1/LOX | \(p_c\) = 1410, 982 psia; O/F 2.36, 2.27 | Merlin-1D-like, F-1-like; frozen sizing; SST | 2 |
The design cases use the default geometry, a design thrust of 2250 lbf (10.01 kN) unless stated, and sea-level ambient conditions.
Grid convergence
The mesh study G1 multiplies every cell count of the base mesh by 1, √2 and 2. Over all three meshes, the thrust, mass flow rate, exit pressure and specific impulse change by at most 0.149 % (inviscid) and 0.355 % (k-ω SST), and the base mesh, which is the coarsest, differs from the finest by at most 0.27 %. That is about two orders of magnitude below the handoff effects discussed below.
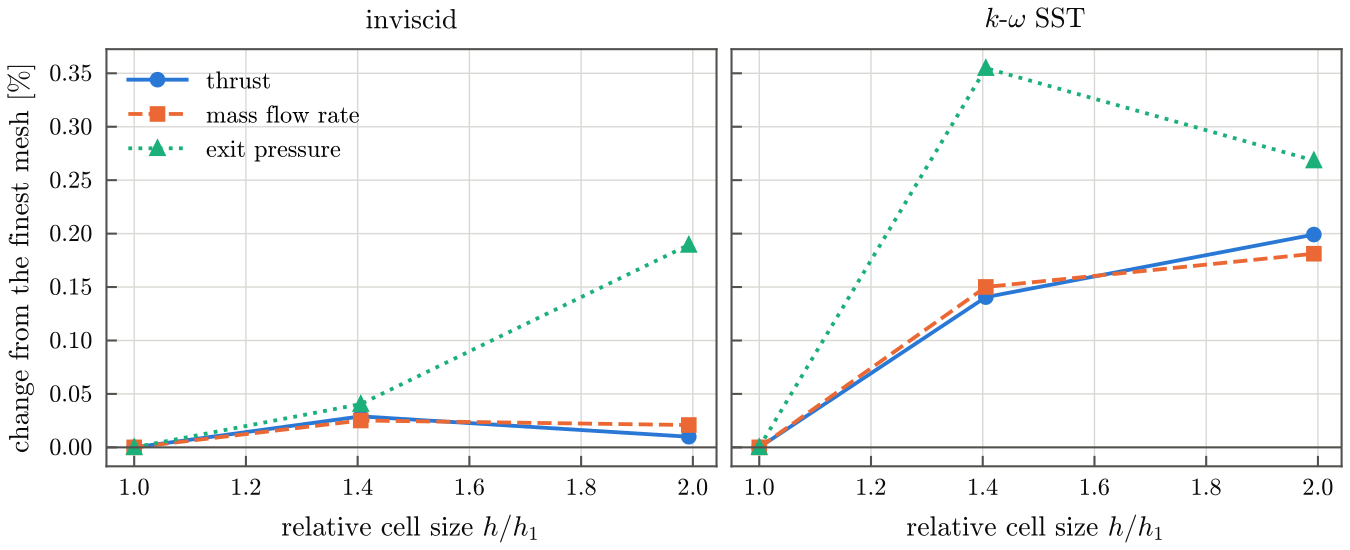
| Model | Quantity | Extrapolated | GCI | GCI (\(p = 2\), \(F_s = 3\)) |
|---|---|---|---|---|
| inviscid | thrust [N] | 9799 | 0.068 % | 0.089 % |
| mass flow [kg/s] | 3.828 | 0.006 % | 0.077 % | |
| exit pressure [Pa] | 1.028 × 10⁵ | 0.020 % | 0.125 % | |
| \(I_{sp}\) [s] | 261.2 | 0.002 % | 0.012 % | |
| SST | thrust [N] | 9713 | 0.117 % | 0.432 % |
| mass flow [kg/s] | 3.812 | 0.046 % | 0.462 % | |
| exit pressure [Pa] | 1.047 × 10⁵ | 0.137 % | 1.09 % | |
| \(I_{sp}\) [s] | 260.0 | 0.007 % | 0.029 % |
The grid convergence index follows Celik et al. (2008). Because the differences between meshes are of the order of the iterative uncertainty and change sign for some quantities, the last column also gives the more conservative index of Roache (1994), with the formal order 2 and a factor of safety of 3.
Validation: wall pressure in conical nozzles
Case V1 reproduces the wall-pressure measurements of Back, Massier and Gier (1965) in two conical nozzles with a 15° divergent cone: a 30° convergent section with a throat radius of curvature of 2.0 throat radii, and a 45° convergent section with 0.625 throat radii. The nozzles are given by their published dimensions (explicit geometry), and the generated contours reproduce the published tangency stations of the throat arcs to 0.001 in.
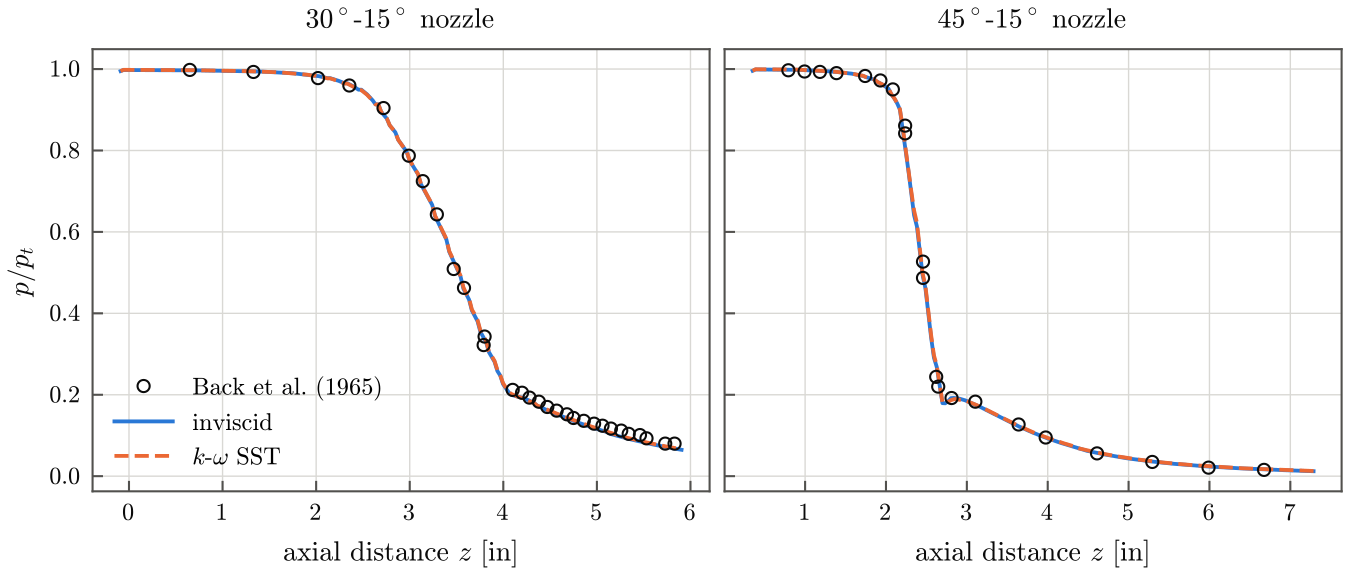
The root-mean-square deviation of \(p/p_t\) from the measurements is 0.011 (30°–15°) and 0.018 (45°–15°), of the order of the combined uncertainty of the digitised data (0.008) and the measurement (1 %). In the 45°–15° nozzle the deviation is concentrated in the transonic region, where the small throat radius of curvature gives the strongest two-dimensional effects; more than one throat radius away from the throat it is 0.0025. The two flow models give nearly the same wall pressures, since the boundary layers of these attached flows are thin.
Validation: discharge coefficient
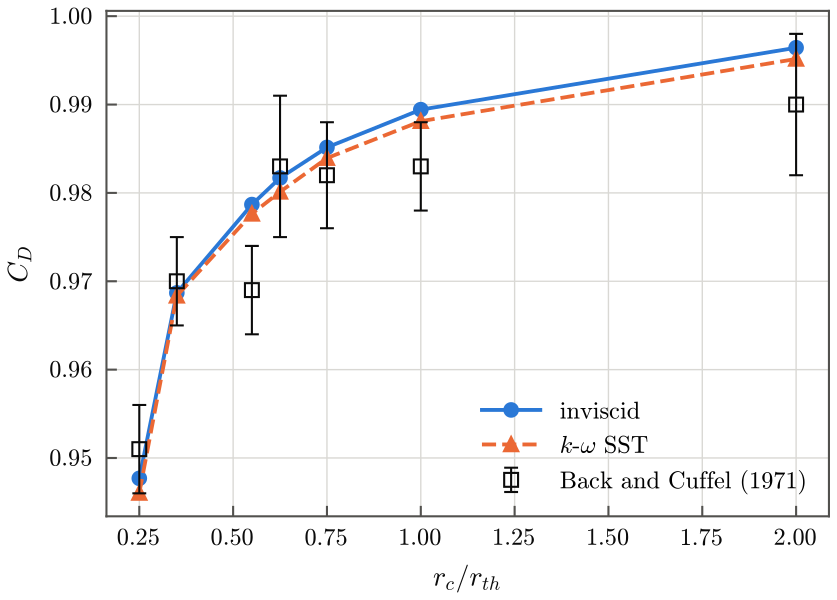
Case V2 compares the computed discharge coefficients with the measurements compiled by Back and Cuffel (1971) for air at throat Reynolds numbers above 10⁶, for throat radii of curvature from 0.25 to 2.0 throat radii.
| \(r_c/r_{th}\) | Convergent half-angle | Measured | Inviscid | SST |
|---|---|---|---|---|
| 0.25 | 75° | 0.951 ± 0.005 | 0.9477 | 0.9460 |
| 0.35 | 30° | 0.970 ± 0.005 | 0.9687 | 0.9684 |
| 0.55 | 30° | 0.969 ± 0.005 | 0.9787 | 0.9776 |
| 0.625 | 45° | 0.983 ± 0.008 | 0.9817 | 0.9801 |
| 0.75 | 30° | 0.982 ± 0.006 | 0.9851 | 0.9839 |
| 1.0 | 30° | 0.983 ± 0.005 | 0.9894 | 0.9881 |
| 2.0 | 30° | 0.990 ± 0.008 | 0.9964 | 0.9952 |
The computed values lie within the measurement uncertainty for 5 of the 7 nozzles. Of the two exceptions, the measurement at 0.55 breaks the trend of the others, and at 1.0 the SST value exceeds the measurement by 0.0051, slightly more than its uncertainty of ±0.005. Contraction and expansion ratios are not published for all of these nozzles and were taken from the 30°–15° nozzle of case V1.
Thermochemical handoff
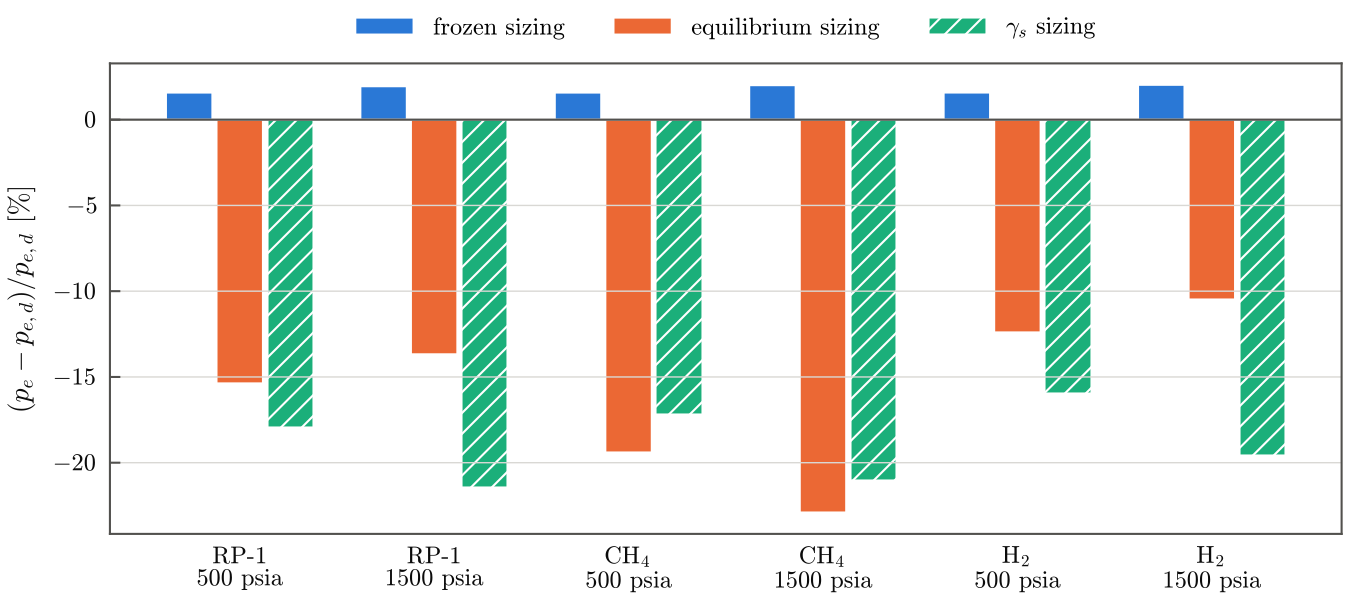
The cases H1 size the same operating point with the three sizing models and compare the inviscid simulation of each nozzle with its own design point. The inviscid model isolates the handoff from viscous losses.
| Case | Frozen \(\Delta p_e\) | Frozen \(\Delta\dot m\) | Frozen \(\Delta F_\lambda\) | Equilibrium \(\Delta p_e\) | Equilibrium \(\Delta\dot m\) | \(\gamma_s\) \(\Delta p_e\) | \(\gamma_s\) \(\Delta\dot m\) | \(\gamma_s\) \(\Delta F_\lambda\) |
|---|---|---|---|---|---|---|---|---|
| RP-1, 500 psia | +1.58 % | −0.54 % | −0.33 % | −15.4 % | +1.97 % | −18.0 % | +0.67 % | −2.96 % |
| RP-1, 1500 psia | +1.95 % | −0.52 % | −0.68 % | −13.7 % | +1.58 % | −21.4 % | +0.47 % | −4.24 % |
| CH₄, 500 psia | +1.58 % | −0.53 % | −0.33 % | −19.4 % | +1.89 % | −17.2 % | +0.20 % | −2.94 % |
| CH₄, 1500 psia | +2.01 % | −0.51 % | −0.71 % | −22.9 % | +1.57 % | −21.1 % | −0.26 % | −4.30 % |
| H₂, 500 psia | +1.58 % | −0.53 % | −0.33 % | −12.4 % | +1.50 % | −16.0 % | +0.41 % | −2.69 % |
| H₂, 1500 psia | +2.03 % | −0.51 % | −0.71 % | −10.5 % | +1.12 % | −19.6 % | +0.22 % | −3.86 % |
\(\Delta F_\lambda\) is the deviation of the thrust from \(\lambda F_d\), the design thrust reduced by the divergence loss of the 15° cone.
With the frozen sizing, the simulated exit pressure is within 2.03 % of the design value, the mass flow rate within 0.54 % (the discharge coefficient of the throat, 0.994 to 0.995), and the thrust within 0.71 % of \(\lambda F_d\). The design and the simulation describe the same gas, and the remaining differences are two-dimensional effects in the transonic region and in the conical divergent section.
With the sizing based on \(\gamma_s\), the exit pressure is 16 to 21 % below the design value, and the deviation grows with the chamber pressure. The mass flow rate is nonetheless within 0.7 % of the design value, because two errors compensate at the throat: \(\Gamma(\gamma_f)/\Gamma(\gamma_s)\) makes the throat 1.6 to 2.4 % larger than the frozen gas requires, while the station-averaged molecular weight lowers the mass flow through it by 0.9 to 1.7 %. The mass flow rate is therefore a poor indicator of an inconsistent handoff. The inconsistency appears in the expansion: the \(\gamma_s\) nozzles have expansion ratios 15 to 21 % larger than the frozen ones.
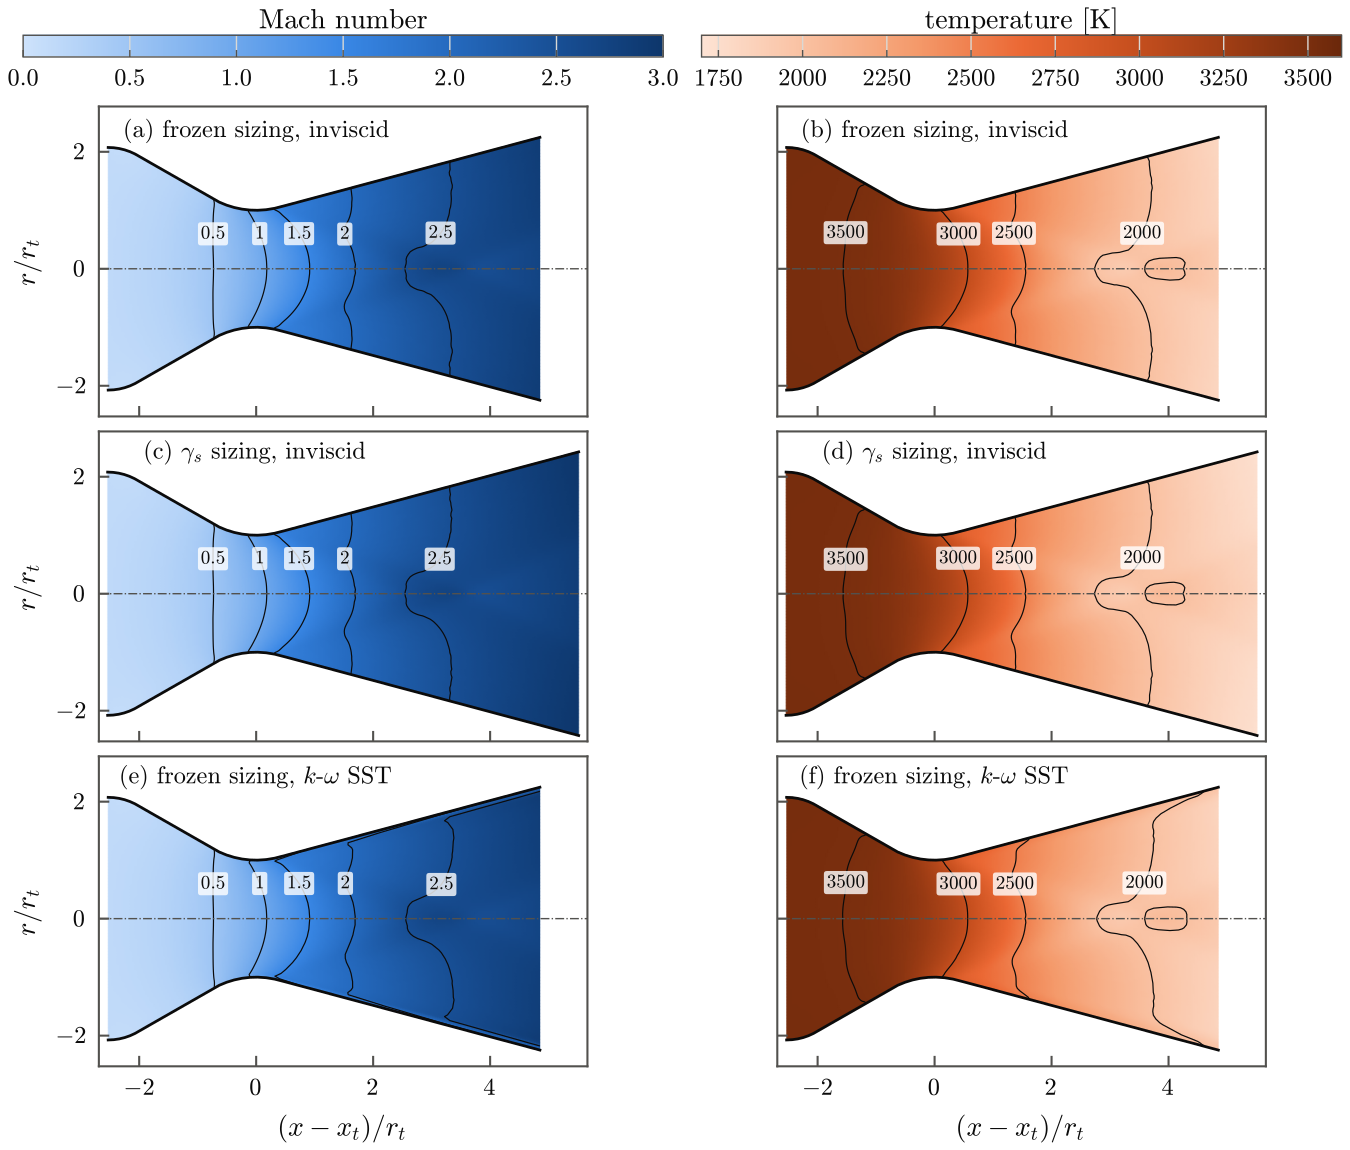
In units of the throat radius the frozen-sized and \(\gamma_s\)-sized flows are almost identical up to the exit of the frozen-sized nozzle, where the gas reaches the ambient pressure on average; the \(\gamma_s\) nozzle continues the expansion and over-expands the gas. The temperature tells the same story: the frozen design point predicts an exit temperature of 1831 K and the simulation gives 1837 K, whereas the \(\gamma_s\) design point predicts 2294 K for a gas that leaves its nozzle at 1761 K.
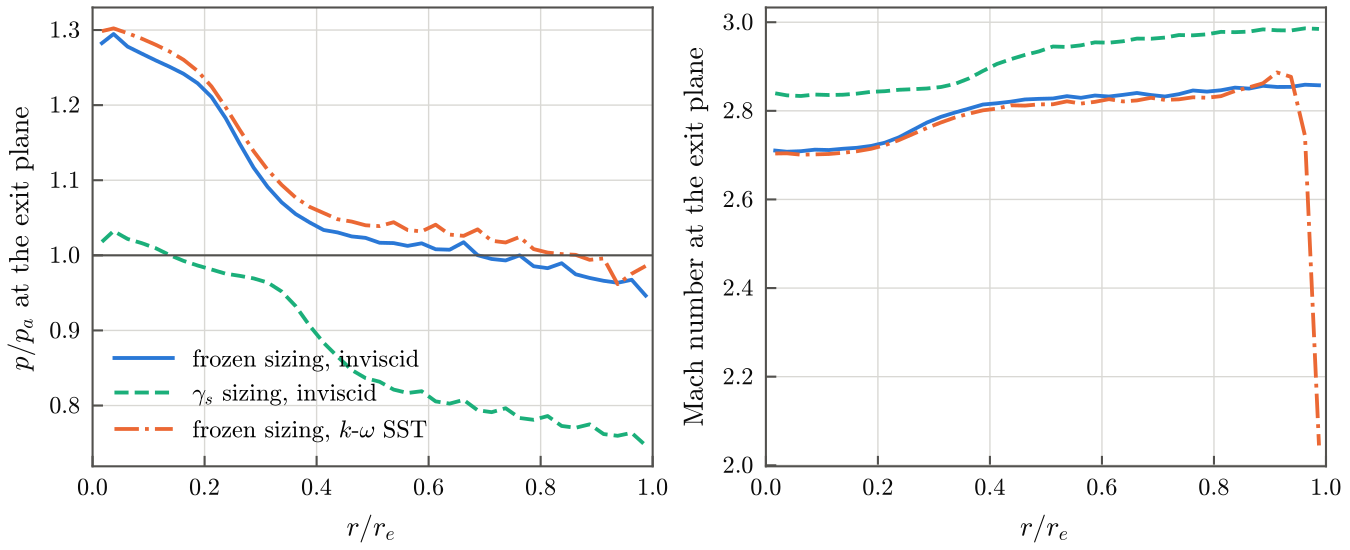
The exit pressure is not uniform, since a nearly conical flow crosses a flat exit plane: near the axis the gas has expanded less than near the wall. In the frozen-sized nozzle the pressure is close to ambient over the outer half of the radius, which carries most of the exit area; in the \(\gamma_s\)-sized nozzle it is below ambient over most of the exit plane.
Viscous losses
The cases H2 add the boundary layer to the frozen-sized nozzles. Relative to the inviscid simulation of the same nozzle, the thrust changes by −0.17 to −0.22 % with the laminar model and by −0.66 to −0.74 % with the k-ω SST model.
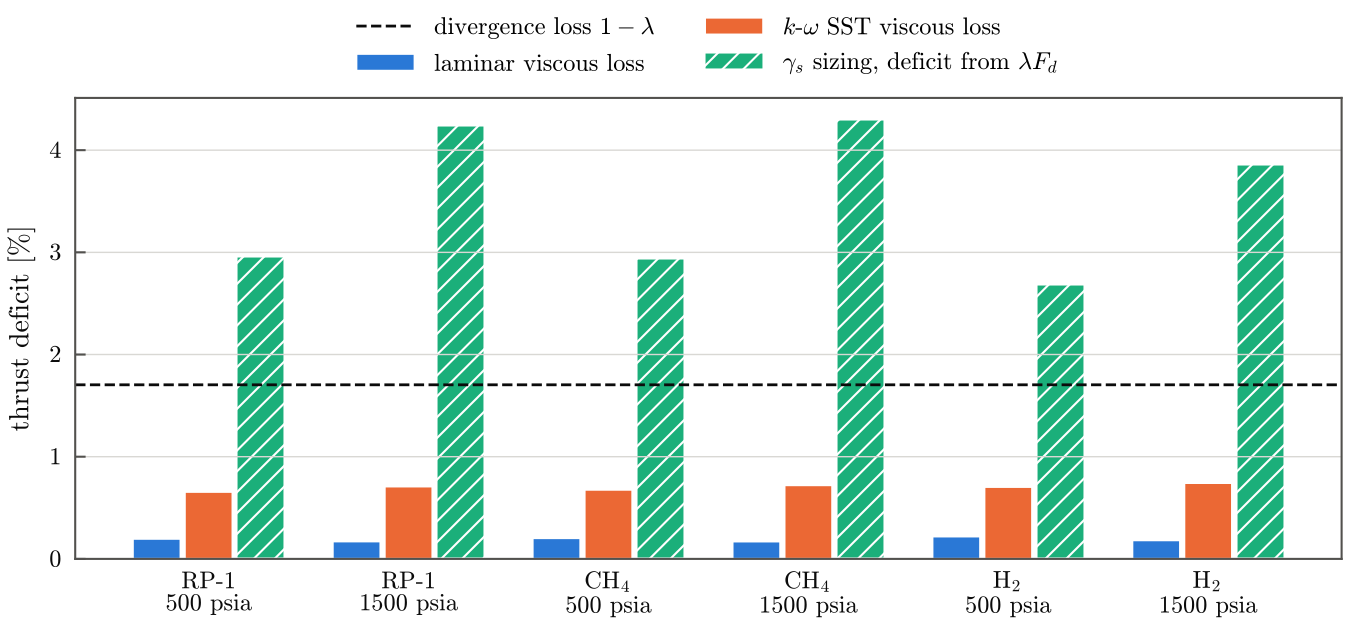
Both viscous losses are smaller than the divergence loss of the 15° cone (1.7 %) and much smaller than the thrust deficit of the \(\gamma_s\) sizing, which would hide the viscous loss entirely. The mesh is not adapted to the near-wall resolution of the SST model, so the SST losses depend on its wall functions; the laminar and SST results bracket the viscous loss between fully laminar and fully turbulent boundary layers.
Large-engine operating points
The cases D1 apply the procedure at the operating points of two large kerosene engines: an F-1-like case (1 522 000 lbf at sea level, 982 psia, O/F 2.27; Betts, 2013) and a Merlin-1D-like case (190 000 lbf at sea level, SpaceX, 2020; the chamber pressure and mixture ratio are not published, and representative values of 1410 psia and O/F 2.36 are used). The nozzles have throat radii of 0.417 m and 0.131 m and are meshed by the same rules, since the cell counts scale with the throat radius. The simulated thrust deviates from \(\lambda F_d\) by −1.1 % and −1.3 %, like the much smaller nozzles of the cases H2, and the discharge coefficients are 0.992. These are demonstrations of the procedure at large scale, not validation cases: the actual contours and operating histories of these engines are not used.
References
- Back, L. H., Massier, P. F., Gier, H. L. (1965). Comparison of measured and predicted flows through conical supersonic nozzles, with emphasis on the transonic region. AIAA Journal 3(9), 1606–1614. doi:10.2514/3.3216
- Back, L. H., Cuffel, R. F. (1971). Flow coefficients for supersonic nozzles with comparatively small radius of curvature throats. Journal of Spacecraft and Rockets 8(2), 196–198. doi:10.2514/3.30247
- Celik, I. B., Ghia, U., Roache, P. J., Freitas, C. J., Coleman, H., Raad, P. E. (2008). Procedure for estimation and reporting of uncertainty due to discretization in CFD applications. Journal of Fluids Engineering 130(7),
- doi:10.1115/1.2960953
- Roache, P. J. (1994). Perspective: A method for uniform reporting of grid refinement studies. Journal of Fluids Engineering 116(3), 405–413. doi:10.1115/1.2910291
- Betts, E. M. (2013). Waking a giant: bringing the Saturn F-1 engine back to life. Presentation, NASA Marshall Space Flight Center, M13-3060 (NTRS 20140011656).
- Space Exploration Technologies Corp. (2020). Falcon User's Guide.